Energy
Tesla is Now the World’s Most Valuable Automaker
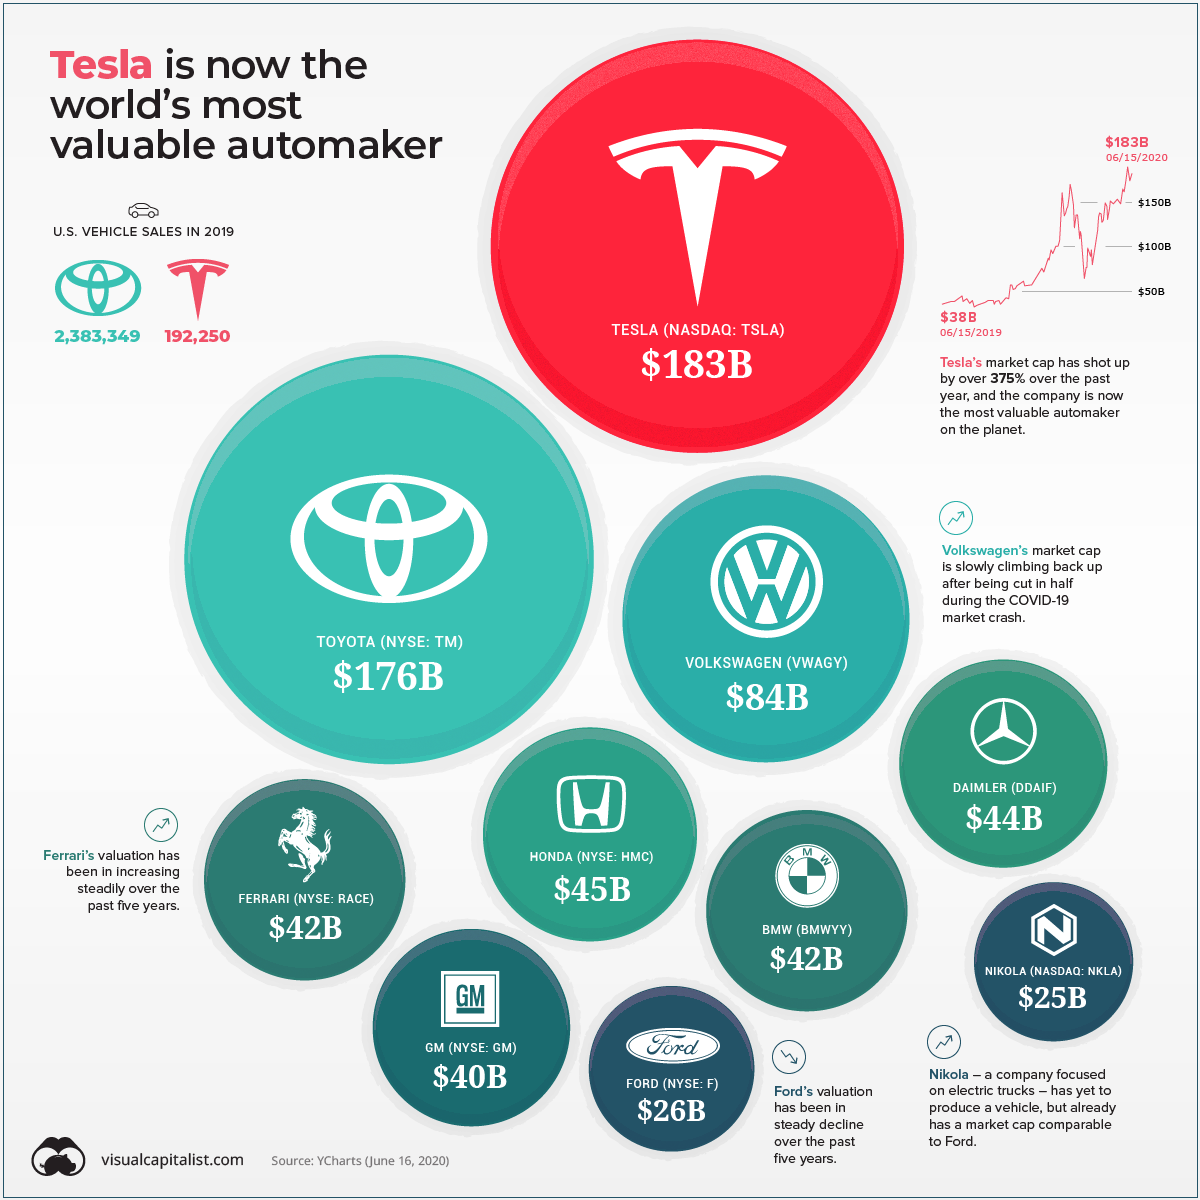
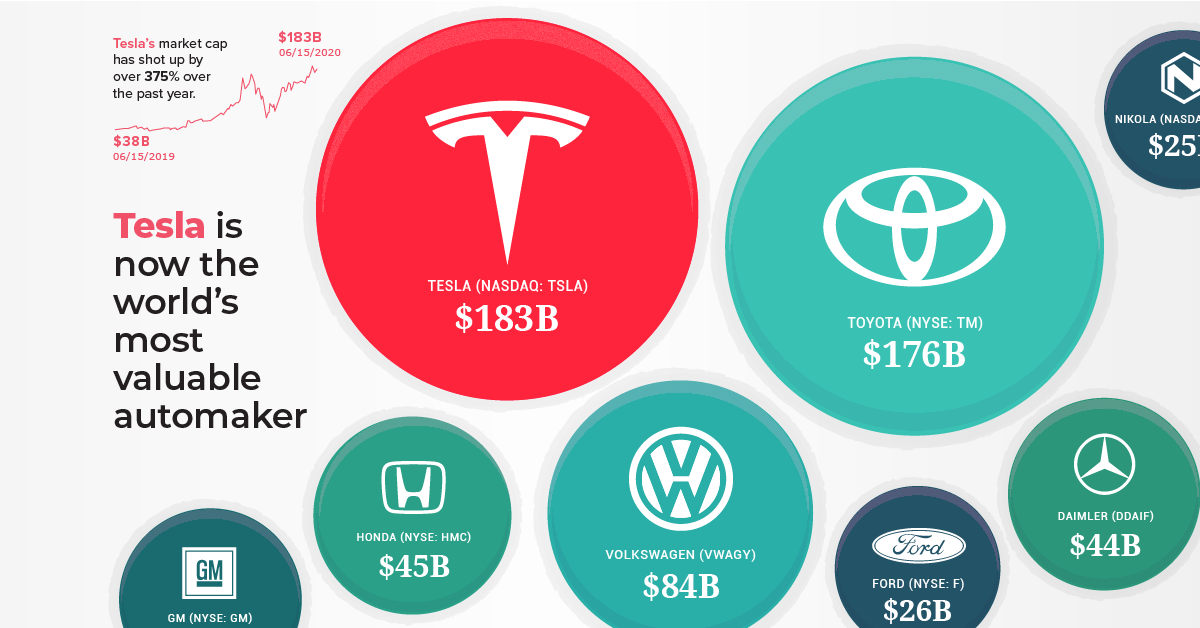
Tesla is Now the World’s Most Valuable Automaker
Even in the midst of a pandemic, Tesla continues to reach new heights.
The company, which began as a problem-plagued upstart a little over 15 years ago, has now become the world’s most valuable automaker – surpassing industry giants such as Toyota and Volkswagen.
This milestone comes after a year of steady growth, which only hit a speed bump earlier this year due to COVID-19’s negative impact on new car sales. Despite these headwinds, Tesla’s valuation has jumped by an impressive 375% since this time last year.
How does Tesla’s value continue to balloon, despite repeated cries that the company is overvalued? Will shortsellers declare a long-awaited victory, or is there still open road ahead?
Tesla’s Race to the Top
Earlier this year, Tesla hit an impressive milestone, surpassing the value of GM and Ford combined. Since then, the automaker’s stock has continued it’s upward trajectory.
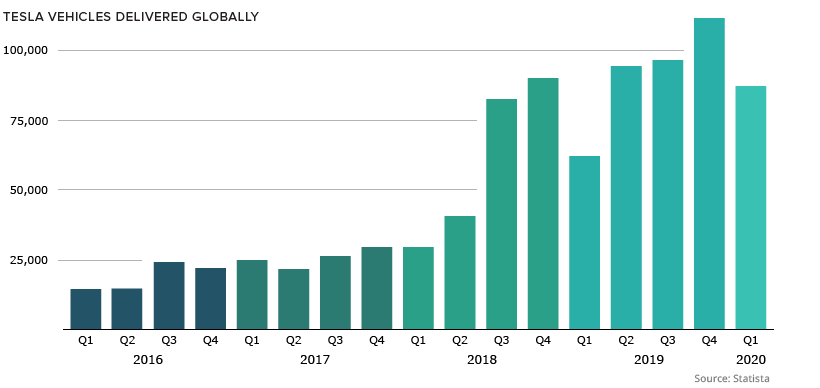
Thanks to the popularity of the Model 3, Tesla sold more cars in 2019 than it did in the previous two years combined:
As well, the company is taking big steps to up its production capacity.
Austin, Texas and Tulsa, Oklahoma are currently rolling out the incentives to attract Tesla’s new U.S.-based factory. The company is also increasing its global presence with the construction of Giga Berlin, it’s first European production facility, as well as completing the ongoing expansion of its Giga Shanghai facility in China.
Battle of the Namesakes
Tesla’s most recent price bump was fueled in part by a leaked internal memo from Tesla’s CEO, Elon Musk, urging the company’s staff to go “all out” on bringing electric semi trucks to the global market at scale.
It’s time to go all out and bring the Tesla Semi to volume production.
– Elon Musk
Of course, Musk’s enthusiasm for semi trucks isn’t coming from nowhere. Another company, Nikola (also named after famed inventor Nikola Tesla), is focused on electrifying the two million or so semi trucks in operation in the U.S. market.
Although Nikola has yet to produce a vehicle, its market cap has surged to $24 billion – which puts its valuation nearly on par with Ford. Much like Tesla, the company already has preorders from major companies looking to add electric-powered trucks to their delivery fleets.
For major brands looking to hit ESG targets, zero-emission heavy-duty trucks is an easy solution, particularly if the vehicles also live up to claims of being cheaper over the vehicle’s lifecycle. The big question is which automaker will capitalize on this mega market first?


Who’s Building the Most Solar Energy?
This was originally posted on our Voronoi app. Download the app for free on iOS or Android and discover incredible data-driven charts from a variety of trusted sources.
In 2023, solar energy accounted for three-quarters of renewable capacity additions worldwide. Most of this growth occurred in Asia, the EU, and the U.S., continuing a trend observed over the past decade.
In this graphic, we illustrate the rise in installed solar photovoltaic (PV) capacity in China, the EU, and the U.S. between 2010 and 2022, measured in gigawatts (GW). Bruegel compiled the data..
Chinese Dominance
As of 2022, China’s total installed capacity stands at 393 GW, nearly double that of the EU’s 205 GW and surpassing the USA’s total of 113 GW by more than threefold in absolute terms.
| Installed solar capacity (GW) | China | EU27 | U.S. |
|---|---|---|---|
| 2022 | 393.0 | 205.5 | 113.0 |
| 2021 | 307.0 | 162.7 | 95.4 |
| 2020 | 254.0 | 136.9 | 76.4 |
| 2019 | 205.0 | 120.1 | 61.6 |
| 2018 | 175.3 | 104.0 | 52.0 |
| 2017 | 130.8 | 96.2 | 43.8 |
| 2016 | 77.8 | 91.5 | 35.4 |
| 2015 | 43.6 | 87.7 | 24.2 |
| 2014 | 28.4 | 83.6 | 18.1 |
| 2013 | 17.8 | 79.7 | 13.3 |
| 2012 | 6.7 | 71.1 | 8.6 |
| 2011 | 3.1 | 53.3 | 5.6 |
| 2010 | 1.0 | 30.6 | 3.4 |
Since 2017, China has shown a compound annual growth rate (CAGR) of approximately 25% in installed PV capacity, while the USA has seen a CAGR of 21%, and the EU of 16%.
Additionally, China dominates the production of solar power components, currently controlling around 80% of the world’s solar panel supply chain.
In 2022, China’s solar industry employed 2.76 million individuals, with manufacturing roles representing approximately 1.8 million and the remaining 918,000 jobs in construction, installation, and operations and maintenance.
The EU industry employed 648,000 individuals, while the U.S. reached 264,000 jobs.
According to the IEA, China accounts for almost 60% of new renewable capacity expected to become operational globally by 2028.
Despite the phasing out of national subsidies in 2020 and 2021, deployment of solar PV in China is accelerating. The country is expected to reach its national 2030 target for wind and solar PV installations in 2024, six years ahead of schedule.

-

 Economy6 days ago
Ranked: The Top 20 Countries in Debt to China
-

 Demographics2 weeks ago
The Countries That Have Become Sadder Since 2010
-

 Money2 weeks ago
Charted: Who Has Savings in This Economy?
-

 Technology2 weeks ago
Visualizing AI Patents by Country
-

 Economy2 weeks ago
Economic Growth Forecasts for G7 and BRICS Countries in 2024
-

 Wealth2 weeks ago
Charted: Which City Has the Most Billionaires in 2024?
-

 Technology1 week ago
All of the Grants Given by the U.S. CHIPS Act
-

 Green1 week ago
The Carbon Footprint of Major Travel Methods